Forex Opinion & Analysis
EUR/USD: Parabolic Wedge Bottom
EUR/USD
+0.05%
Add to/Remove from Watchlist
Add to Watchlist
Add Position
Position added successfully to:
Please name your holdings portfolio
Type:
BUY
SELL
Date:
Amount:
Price
Point Value:
Leverage:
1:1
1:10
1:25
1:50
1:100
1:200
1:400
1:500
1:1000
Commission:
Create New Watchlist
Create
Create a new holdings portfolio
Add
Create
+ Add another position
Close
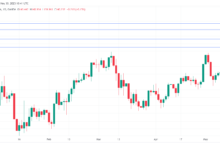
 EUR/USD Daily Chart
- The EUR/USD is forming a parabolic wedge bottom (purple line) after testing the March 24th low.
- The bulls want a strong reversal up; however, as I have said several times, the selloff from the May high is tight. This increases the odds that the first reversal up will be minor.
- It is reasonable for the bears to exit above today’s bar due to the risk of the pullback being deeper than what the bulls would want to hold through.
- The market has been in a tight bear channel within a trading range for several bars. Even though the bear channel is tight, traders cannot be in denial if the bulls start to get 2-3 consecutive strong bull closes. Even if the bulls get strong closes, the odds favor more sideways trading.