Bitcoin, Ethereum Could Be Setting Up for Breakouts This Week
BTC/USD
+0.90%
Add to/Remove from Watchlist
Add to Watchlist
Add Position
Position added successfully to:
Please name your holdings portfolio
Type:
BUY
SELL
Date:
Amount:
Price
Point Value:
Leverage:
1:1
1:10
1:25
1:50
1:100
1:200
1:400
1:500
1:1000
Commission:
Create New Watchlist
Create
Create a new holdings portfolio
Add
Create
+ Add another position
Close
ETH/USD
+0.71%
Add to/Remove from Watchlist
Add to Watchlist
Add Position
Position added successfully to:
Please name your holdings portfolio
Type:
BUY
SELL
Date:
Amount:
Price
Point Value:
Leverage:
1:1
1:10
1:25
1:50
1:100
1:200
1:400
1:500
1:1000
Commission:
Create New Watchlist
Create
Create a new holdings portfolio
Add
Create
+ Add another position
Close
- Both Bitcoin and Ethereum tested their resistances last week
- However, bulls failed to gather necessary momentum for a breakout
- Both cryptos should look for a new test of the resistances this week
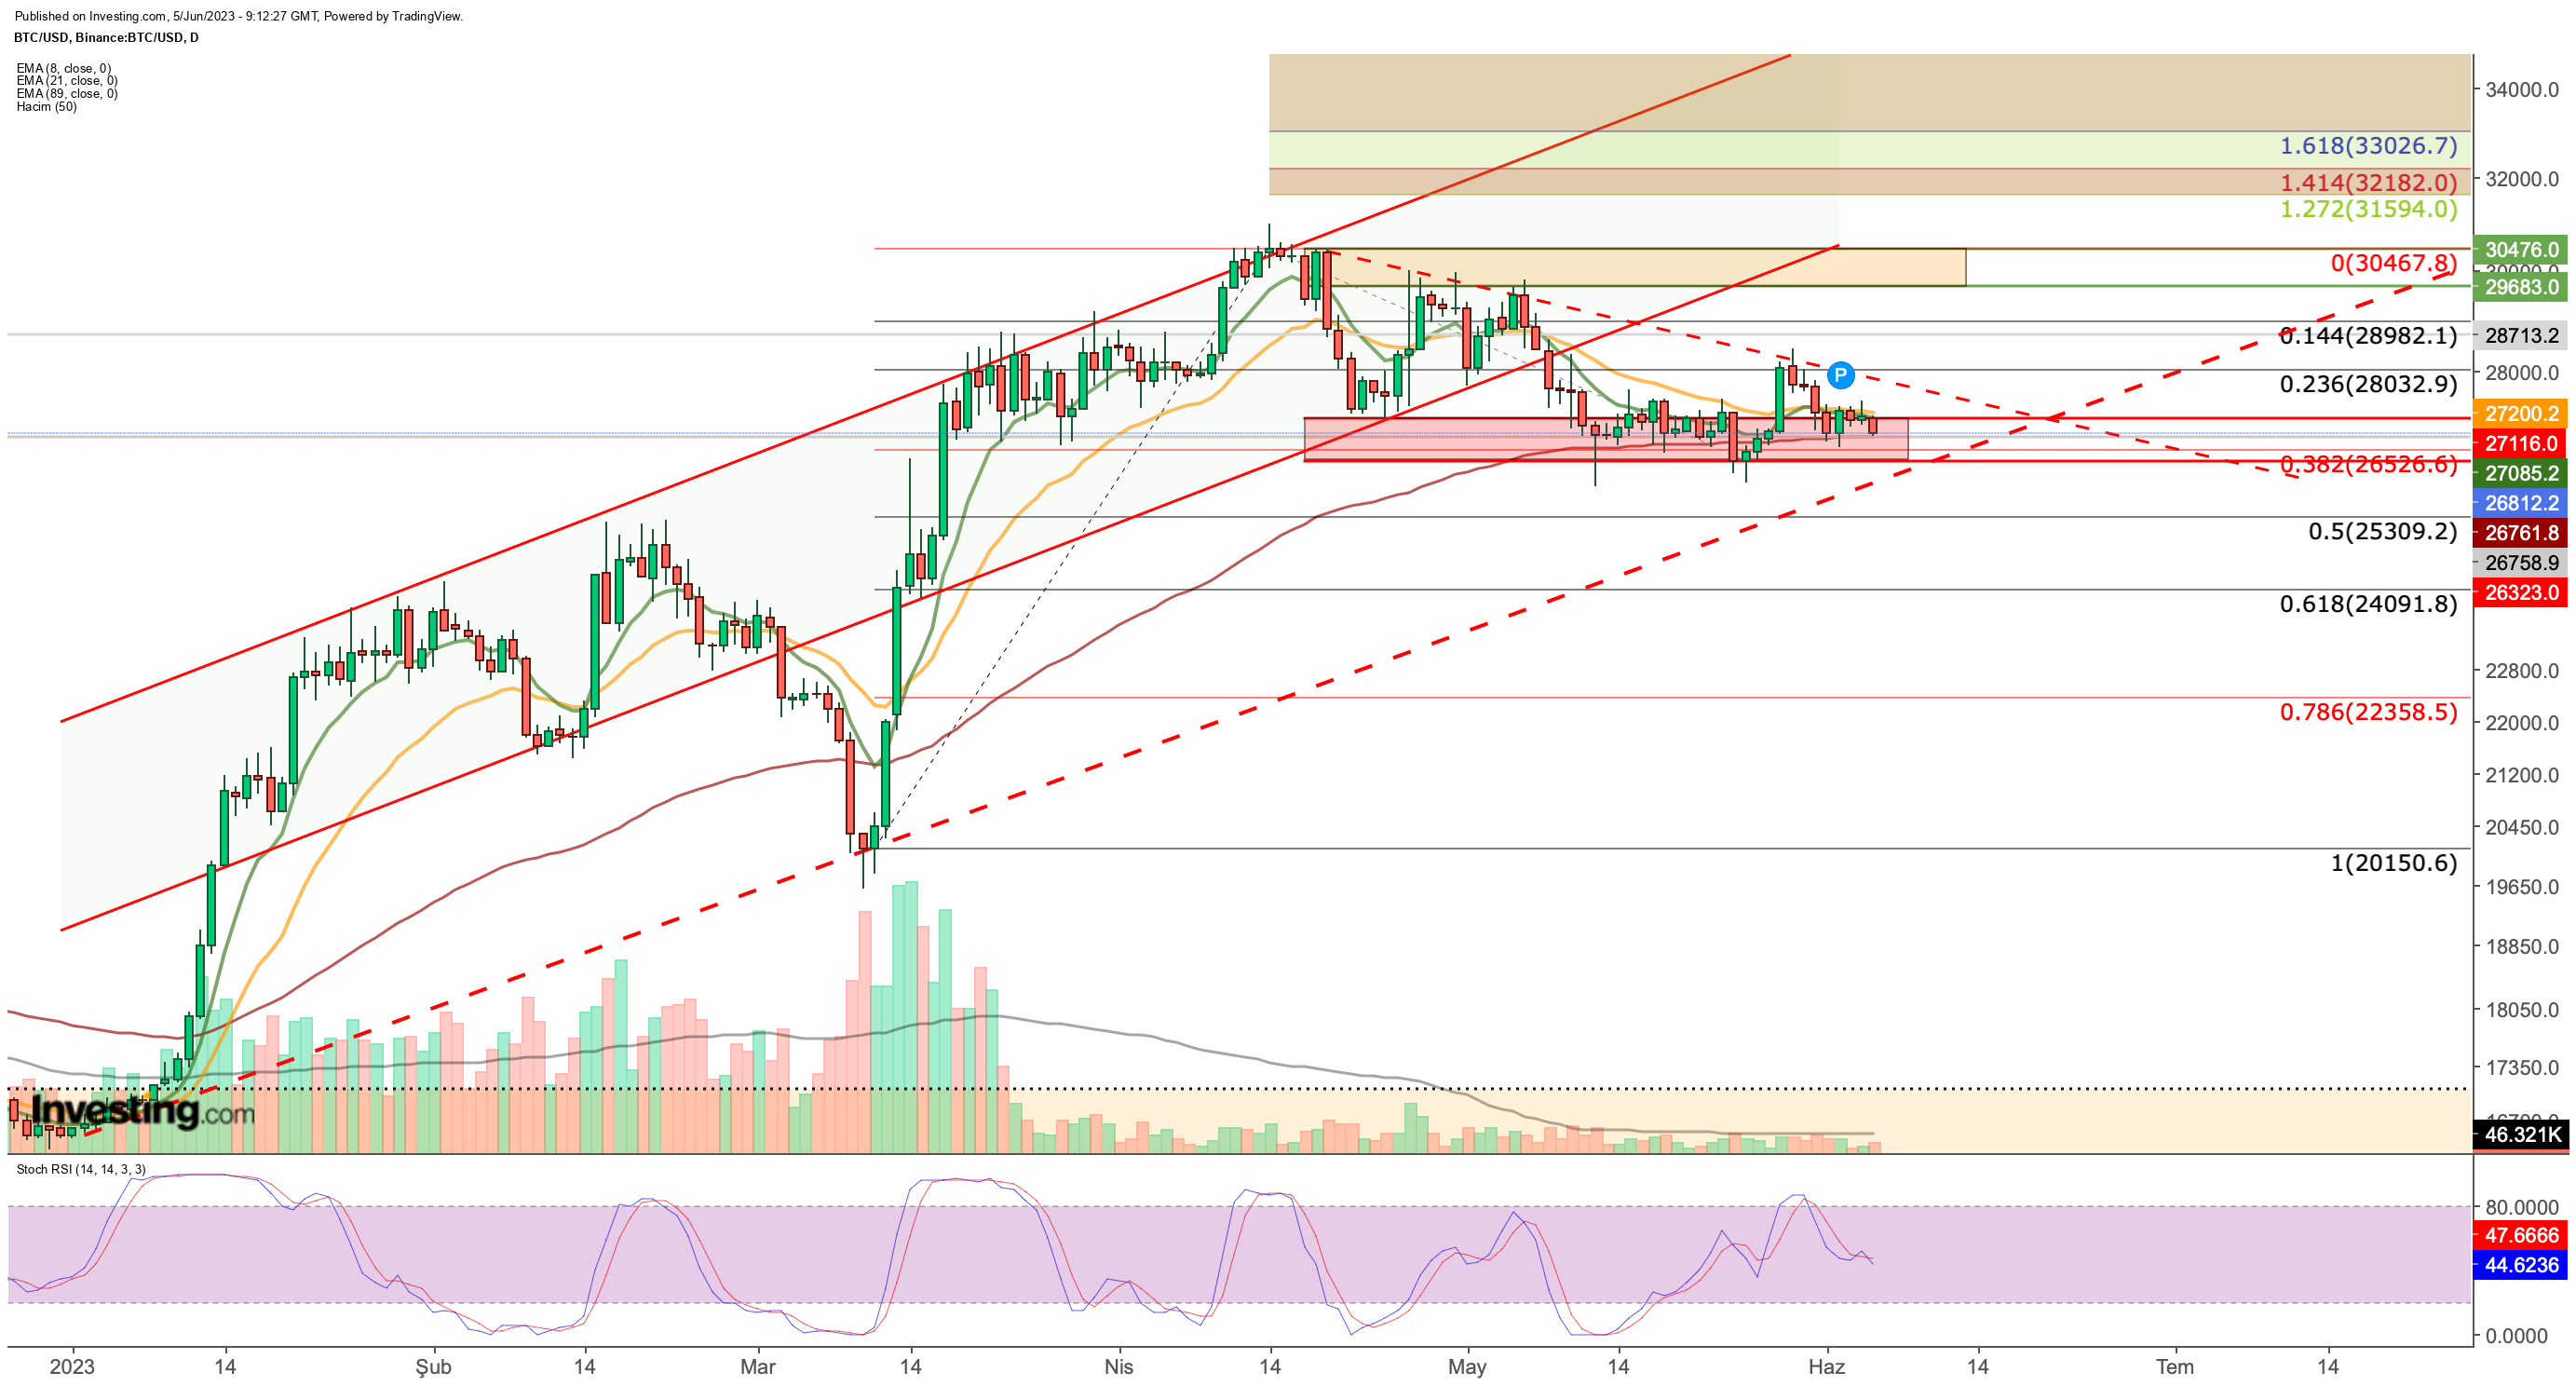
Bitcoin has maintained a narrow trading range between $26,300 and $27,300 for about a month. The declining trading volume suggests a consolidation phase for the cryptocurrency.
However, price movements breaching the range have lacked the necessary momentum to spark a significant trend reversal.
 BTC/USD Price Chart
BTC recently encountered resistance at the $28,000 level. Currently, the $26,500 level has acted as a reliable support. Additionally, the $26,300 level, which has been tested twice within the past month, is a crucial support level.
A close below $26,500 this week could result in the cryptocurrency breaking its 2023 uptrend. This breach could be a trend reversal for BTC, and a new downtrend targeting support levels at $25,300, $24,100, and $22,350, could ensue.
The cryptocurrency has to stay above $27,100 to avoid downside risks. Such a breakthrough would indicate an increase in buyer volume, providing BTC with the strength to surpass the $28,000 resistance level.
In the event of a potential recovery, BTC may encounter intermediate resistance around $29,000, following the $28,000 mark. Subsequently, close attention will be paid to the main resistance zone ranging from $29,600 to $30,500.
This zone aligns with the midline of the ascending channel movement observed in 2023 and will be a critical price range to monitor for the continuation of the uptrend.
On the daily chart, moving averages support the $26,500 — $27,100 band as an important support zone. BTC price is currently between the short-term EMA values.
In this case, the EMA value positioned at $26,500 confirms that this level is a critical support point. At the same time, the coincidence of the 89 EMA with the bottom line of the ascending channel increases the probability of a breakout.
To summarize, Bitcoin’s net close of the day below $26,500 or a drop in volume technically indicates that the price could trigger a rapid decline.
Ethereum
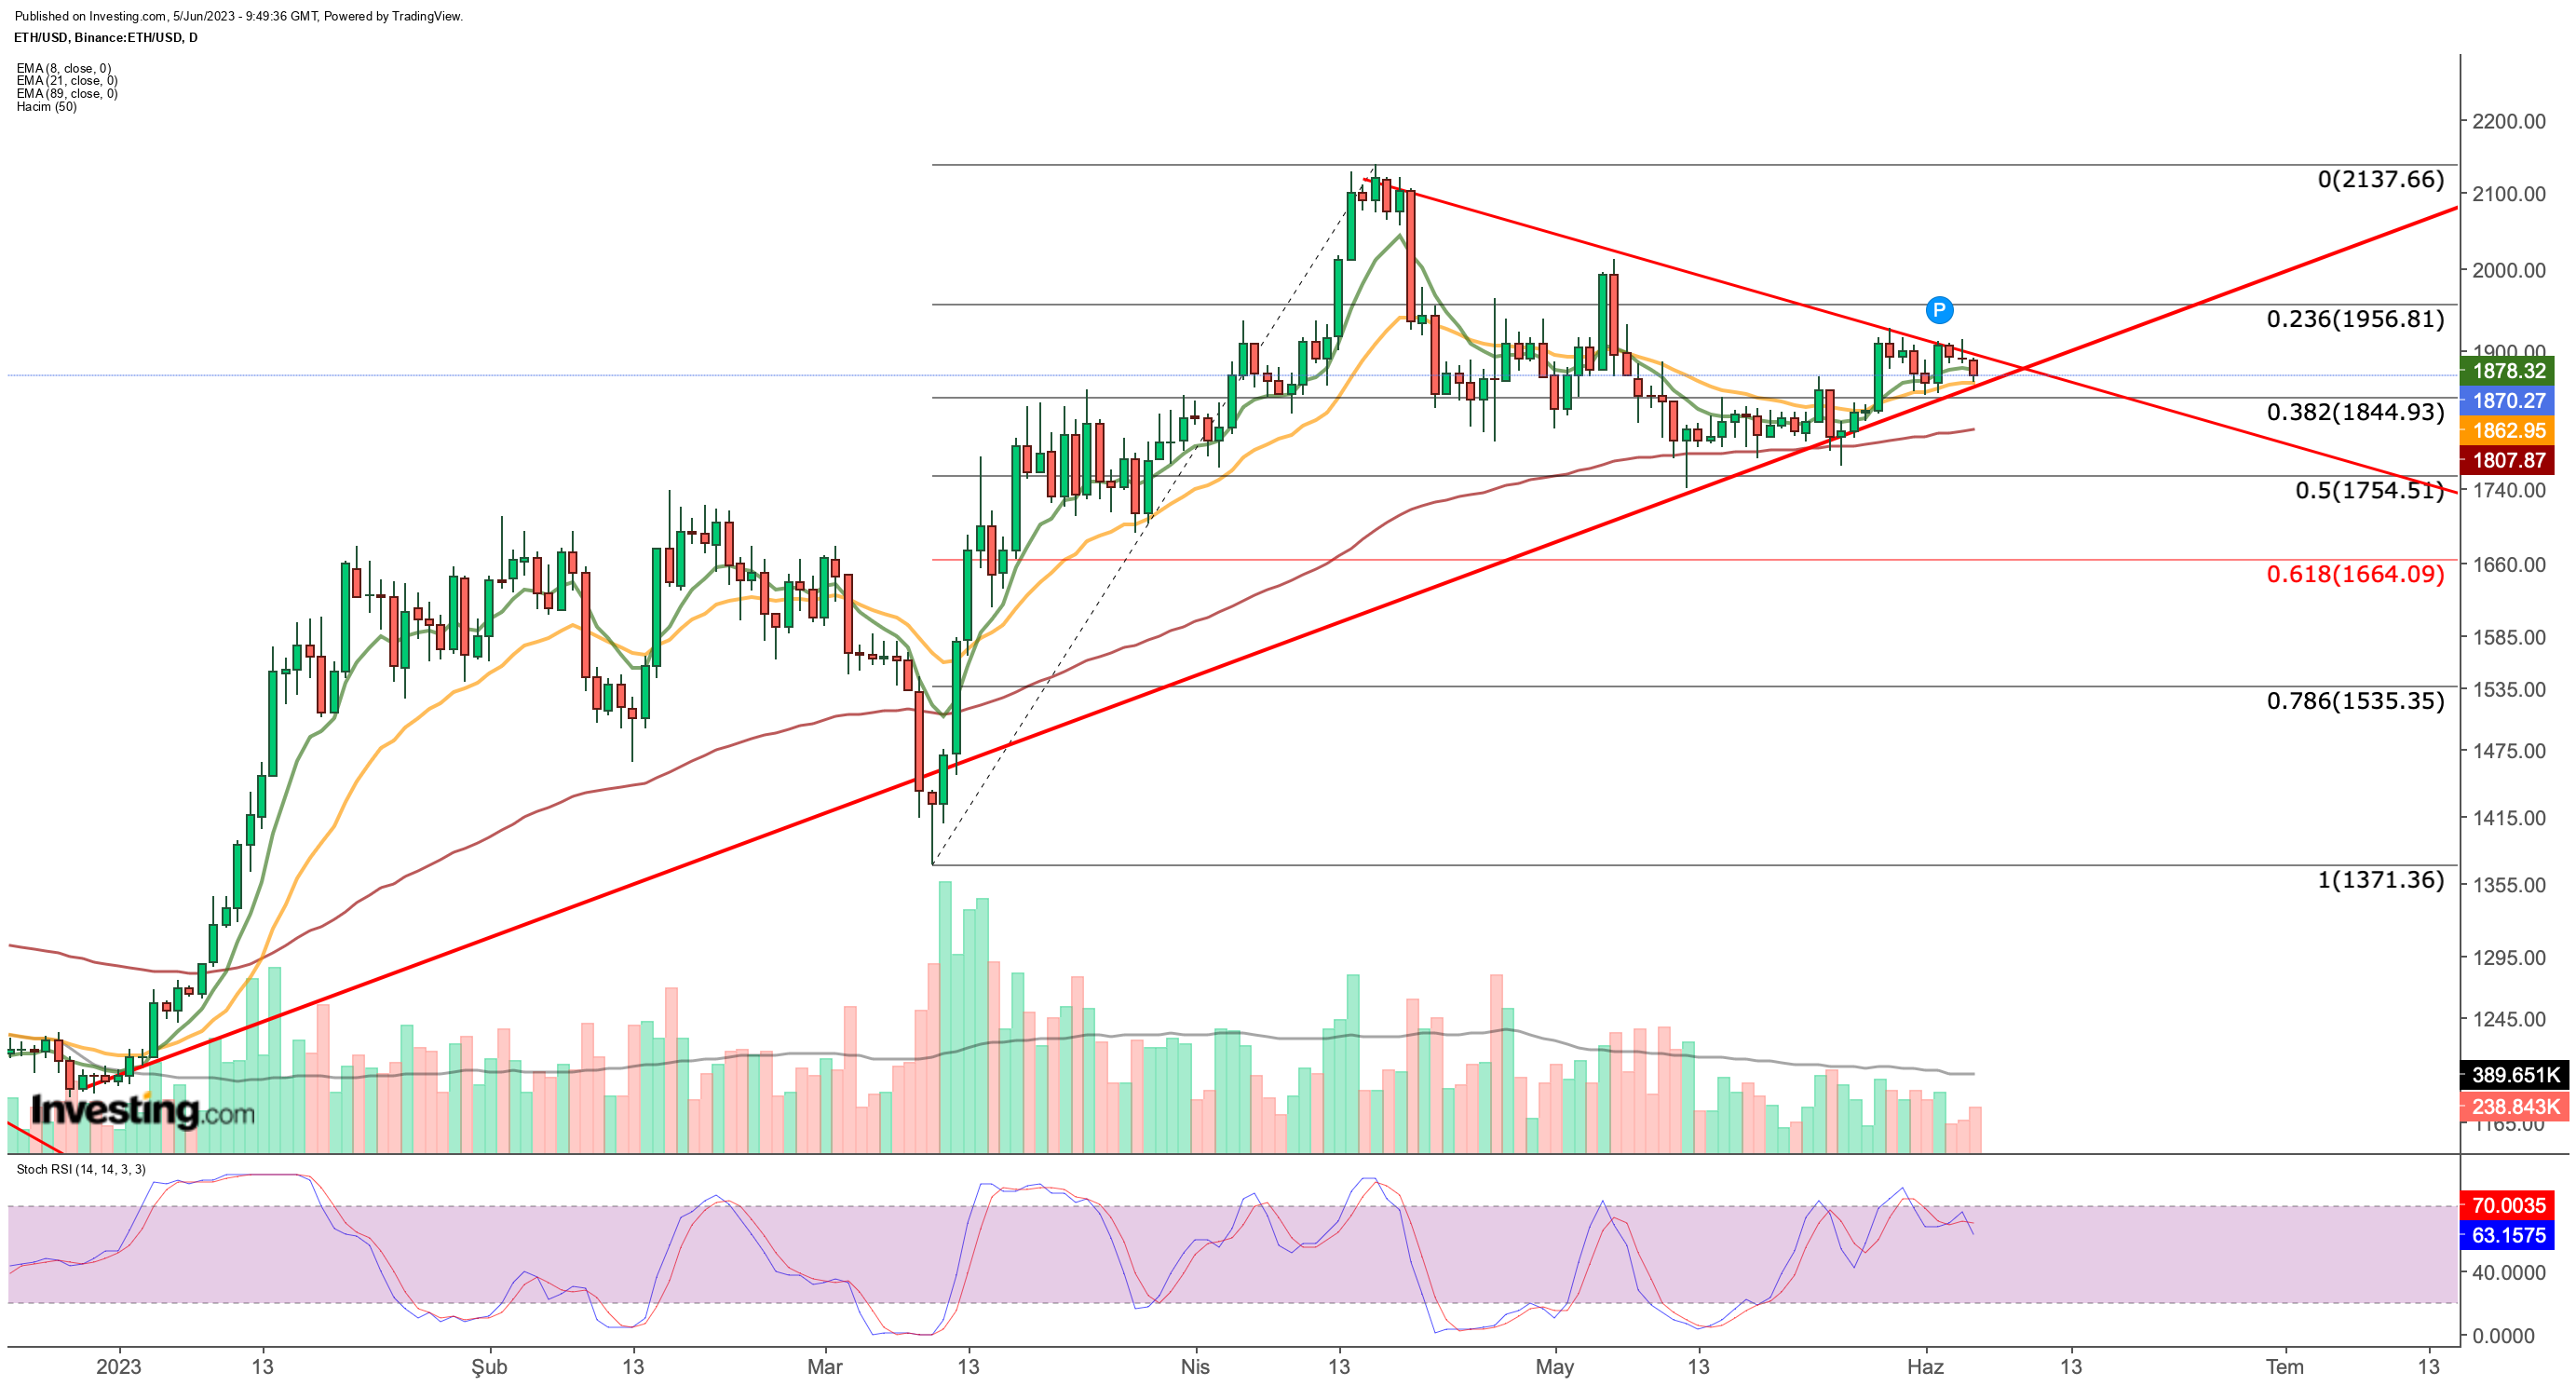
Ethereum enters the week following the ascending trend line. However, it faces challenges in breaking the short-term downtrend line that started in mid-April.
 ETH/USD Günlük Grafik
The ETH daily chart currently shows a triangle formation, suggesting that the price may soon experience increased volatility. If ETH closes below $1,850, it could indicate a downward breakout from the triangle, leading to a potential decline toward $1,660.
On the other hand, if ETH opens and closes above $1,950, it would confirm an upside breakout and may set a target of $2,100, which is a key level.
 Find All the Info you Need on InvestingPro!


